
What Is a Heatmap?
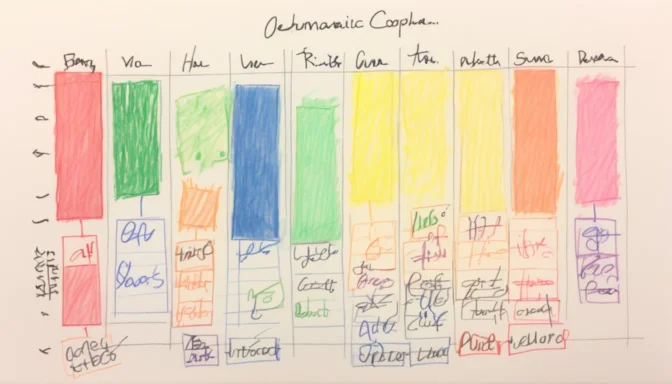
Simply put, a heatmap is a two-dimensional graphical representation where the values are represented through a color gradient. These are employed to quickly understand and interpret complex data on two dimensions.
Uses of Heatmaps
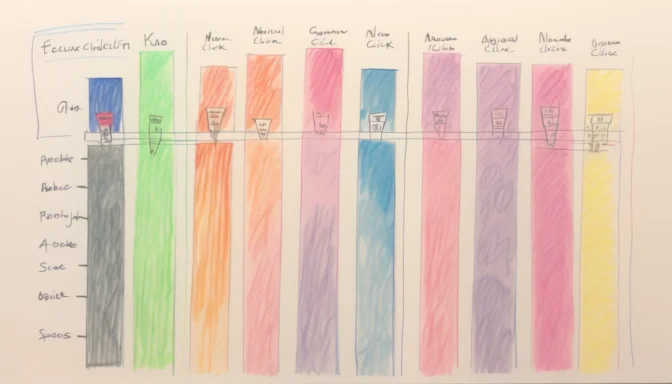
Predominantly, heatmaps are used for showing user behavior on websites. They display areas where users click the most, their scrolling patterns, and focus areas in eye-tracking tests.
How Do Heatmaps Work?

The essence of a heatmap is to use a color spectrum to represent different values, offering an easily digestible view of data. Warm colors like red symbolize high levels of interaction, while cooler shades like blue indicate lesser activity.
Real-World Examples of Heatmaps

Travel websites often utilize geo-heatmaps to spotlight popular tourist destinations, thereby helping travelers to formulate optimal itineraries based on activity levels or interest in particular regions.
Data Types Best Suited for Heatmaps

Heatmaps excel in visualizing spatial data like population density, disease spread, and weather conditions. They facilitate easy identification of trends, inconsistencies, and patterns.
Hotspot vs Heatmap

Though both relate to data density, heatmaps and hotspots are different. Hotspot analysis is about data clustering to indicate 'hot' zones, whereas heatmaps show relative density throughout the data set without pinpointing clusters.
Heatmaps in Excel
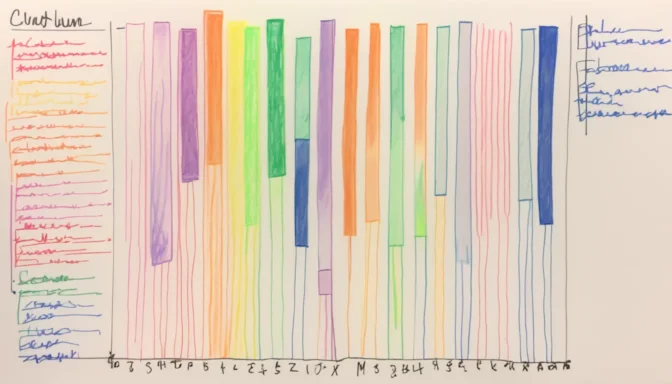
Excel employs heatmaps to distinguish areas of varying impact in data. Color intensity in these heatmaps reflects the significance of different data series, channeling focus towards essential points.
Cons of Using Heatmaps
A downside of using heatmaps is their potential lack of real-time data. Types like mouse-tracking heatmaps may not entirely capture accurate user behavior.
What Can We Infer from Heatmaps?
Heatmaps allow us to gauge density or intensity of variables, unearth patterns, and spot anomalies. They facilitate understanding relationships between the axes, thereby aiding in data analysis and informed decision-making.