
What is the TTI Response Time?
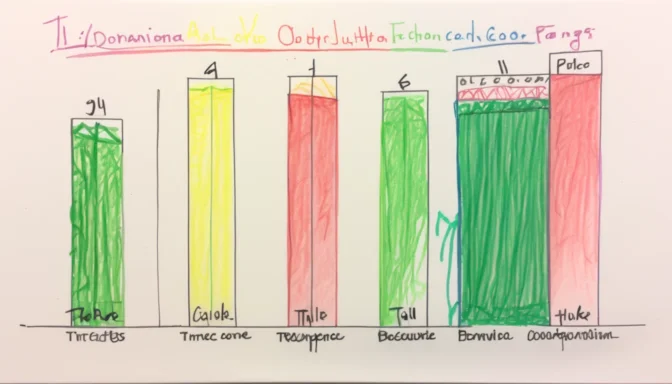
TTI, or Time to Interactive, is measured by Lighthouse and calculated in seconds. A TTI score of 0 to 3.8 seconds is considered fast, 3.9 to 7.3 seconds is moderate, and anything above 7.3 seconds is deemed slow.
What Constitutes a Good Time to Interactive Score?
A good TTI score is generally less than 3.8 seconds. This ensures that the user experience is optimized, making it competitive with high-ranking sites on both mobile and desktop platforms.
How is TTI Calculated?

Calculating TTI involves identifying the First Contentful Paint and a 5-second quiet window. During this window, the main thread should not process tasks taking more than 50 milliseconds and should not wait for more than two server responses.
TTI Versus First Input Delay
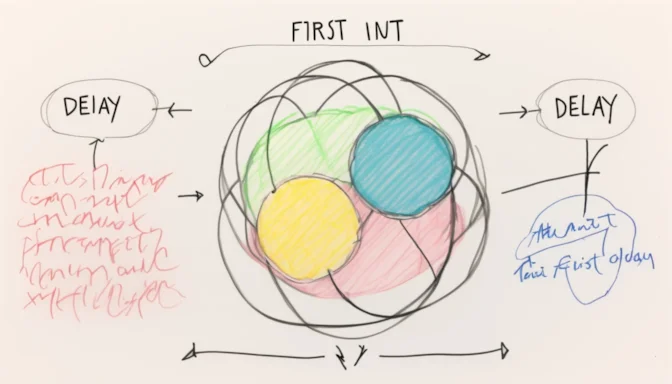
While TTI measures the time until a page is fully interactive, First Input Delay (FID) focuses on the latency between a user's first interaction and the browser's response. These metrics offer different insights into web performance.
Google's Take on Time to Interactive
Google uses TTI as a lab metric to identify potential performance issues. Even if a page appears responsive, underlying code could be affecting its interactivity, which is captured by TTI.
Time to Interactive vs Speed Index
TTI measures when a website becomes fully interactive for the user, whereas Speed Index evaluates how quickly visible elements load on a page. Both metrics are valuable for understanding site performance.
Achieving a Good First Input Delay Score

For a satisfactory user experience, aim for a First Input Delay of 100 milliseconds or less. This should be measured at the 75th percentile for both mobile and desktop users to ensure wide-reaching performance.
Understanding High Time to Interactive

High TTI values indicate poor performance. TTI below 2468 milliseconds is good, between 2468 and 3280 milliseconds may require improvement, and anything above 3280 milliseconds is longer than recommended.
What is the TTI Score?
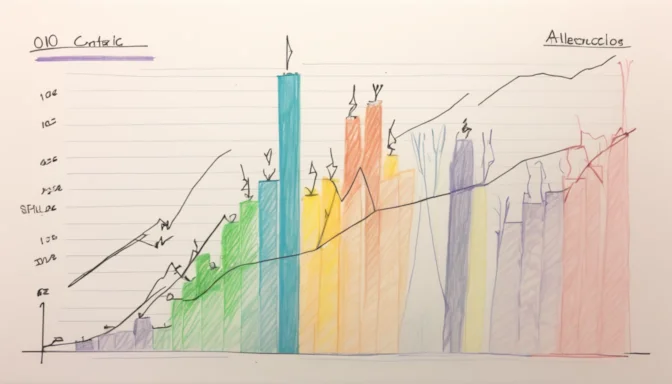
The TTI score is a comparative metric, based on real-world data from the HTTP Archive. For example, a TTI of 2.2 seconds would yield a TTI score of 99, putting it in the ninety-ninth percentile of websites.